Database Panel
The Database panel manages everything that lives inside one database: schema, storage layout, indexes, dictionary, time series, metrics, settings and per-database backups.
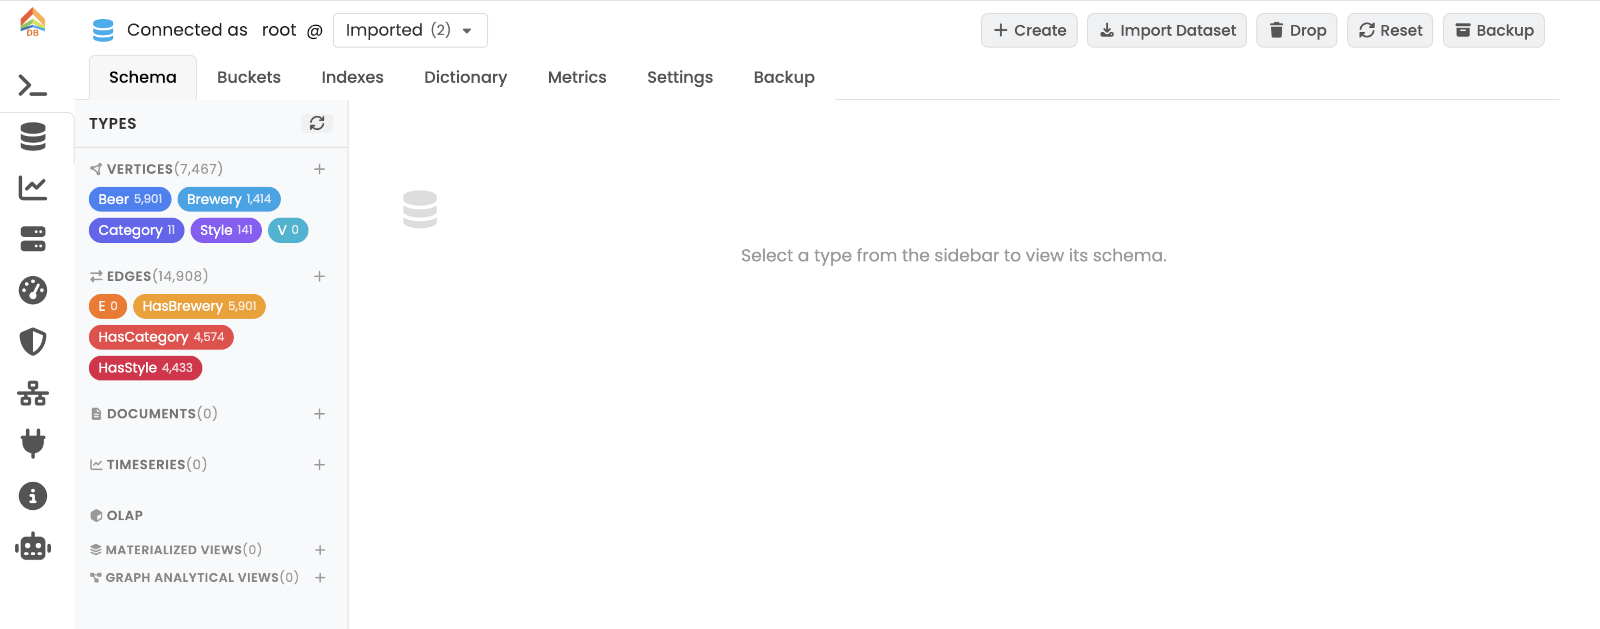
The header shows the current user, the database selector, and the database-level actions:
-
Create Database — create a new database from a name.
-
Import Dataset — open a modal to import a dataset (e.g. importer formats, JSON, OrientDB or Neo4j export).
-
Drop Database — irreversible removal of the current database.
-
Reset Database — drop all data and schema while keeping the database file.
-
Backup Database — trigger an immediate backup of the current database. The resulting file is written under
backups/<db-name>/<db-name>-backup-<timestamp>.zip. See Backup.
The panel is split into seven sub-tabs.
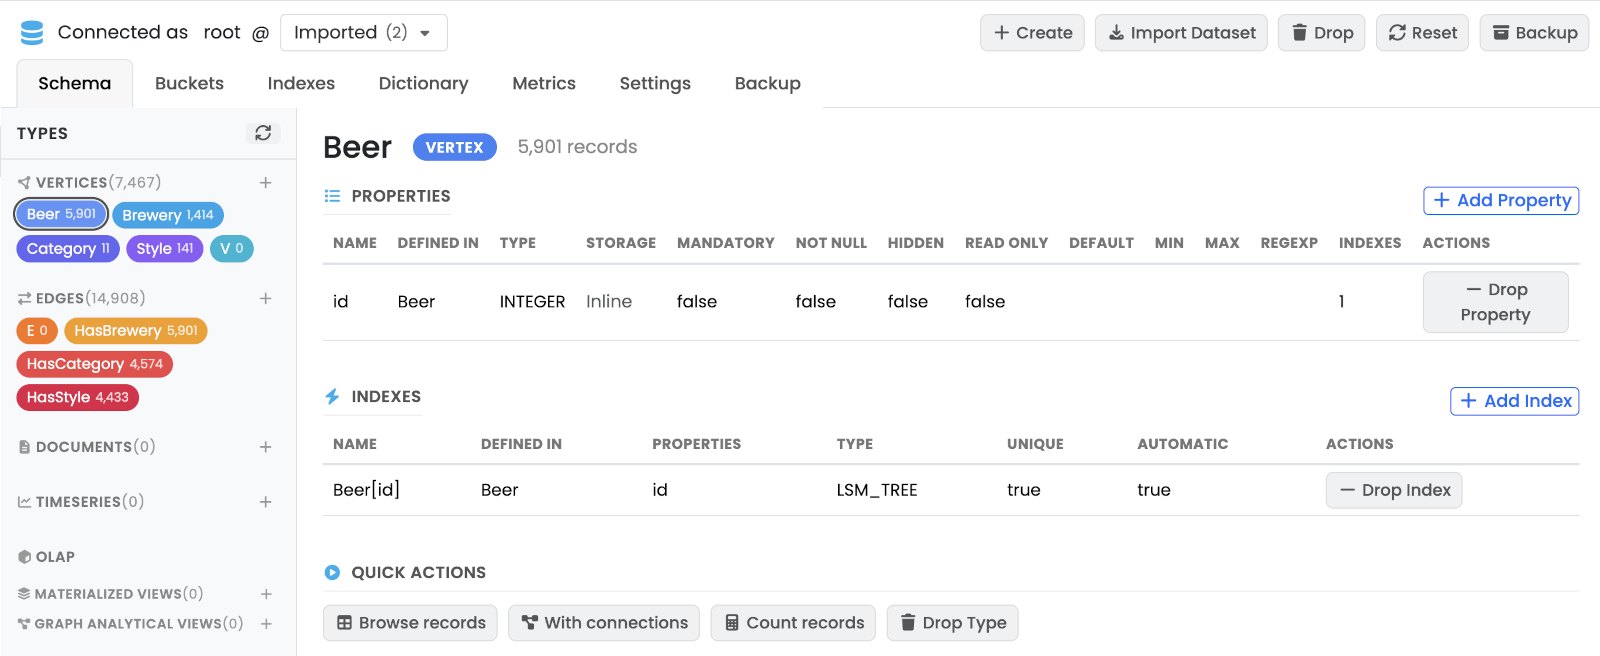
Schema
Lists every type in the database (document types, vertex types and edge types) in a scrollable left sidebar. Selecting a type loads its detail on the right: declared properties (name, type, constraints), indexes built on the type, parent / child types, and quick-action buttons.
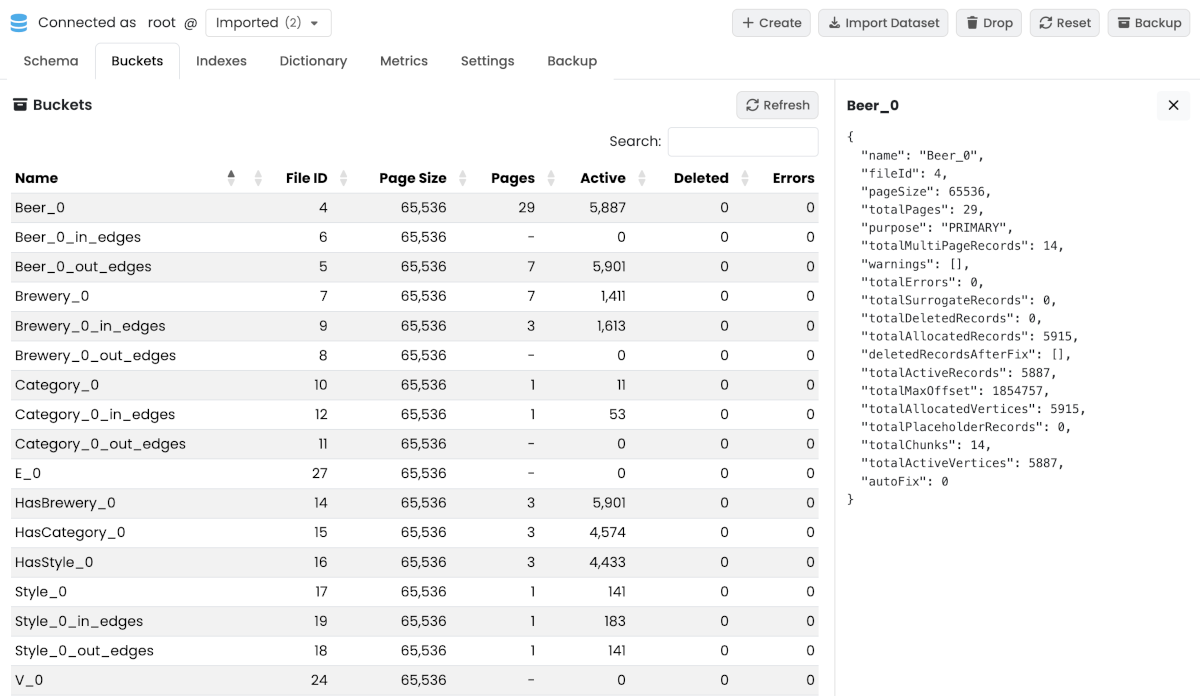
Buckets
Lists the storage buckets that back the database. Selecting a row opens a detail panel on the right with file path, record count, page count and per-bucket counters.
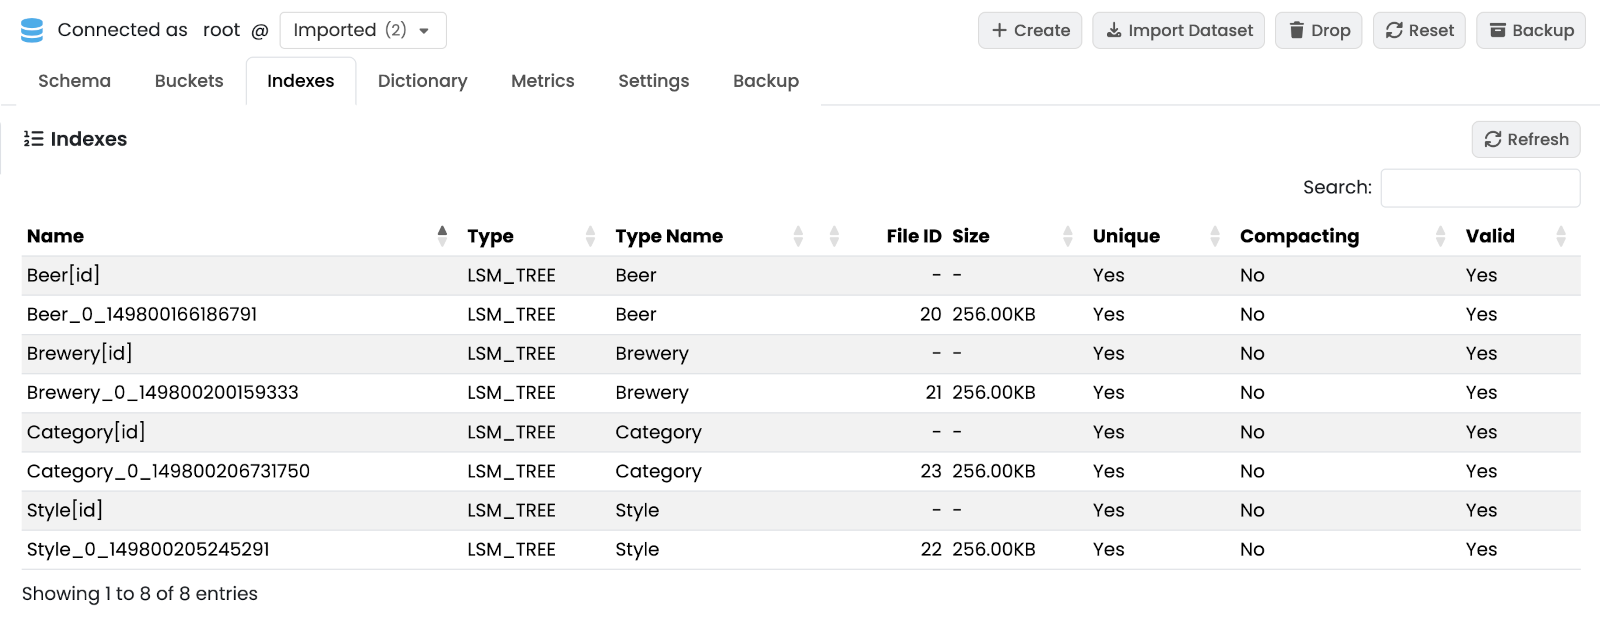
Indexes
Lists every index defined on the database with type, properties, status and entry count. Selecting a row opens a detail panel with the index definition and statistics.
The Add Index dialog has a Build Mode option, default or SORTED, for LSM_TREE indexes (since v26.11.1). SORTED adds METADATA {"buildMode":"SORTED"} to the generated CREATE INDEX, which builds a large index much faster. The option is hidden for the other index algorithms, which do not support it, and the sorted build is refused on replicated databases.
Dictionary
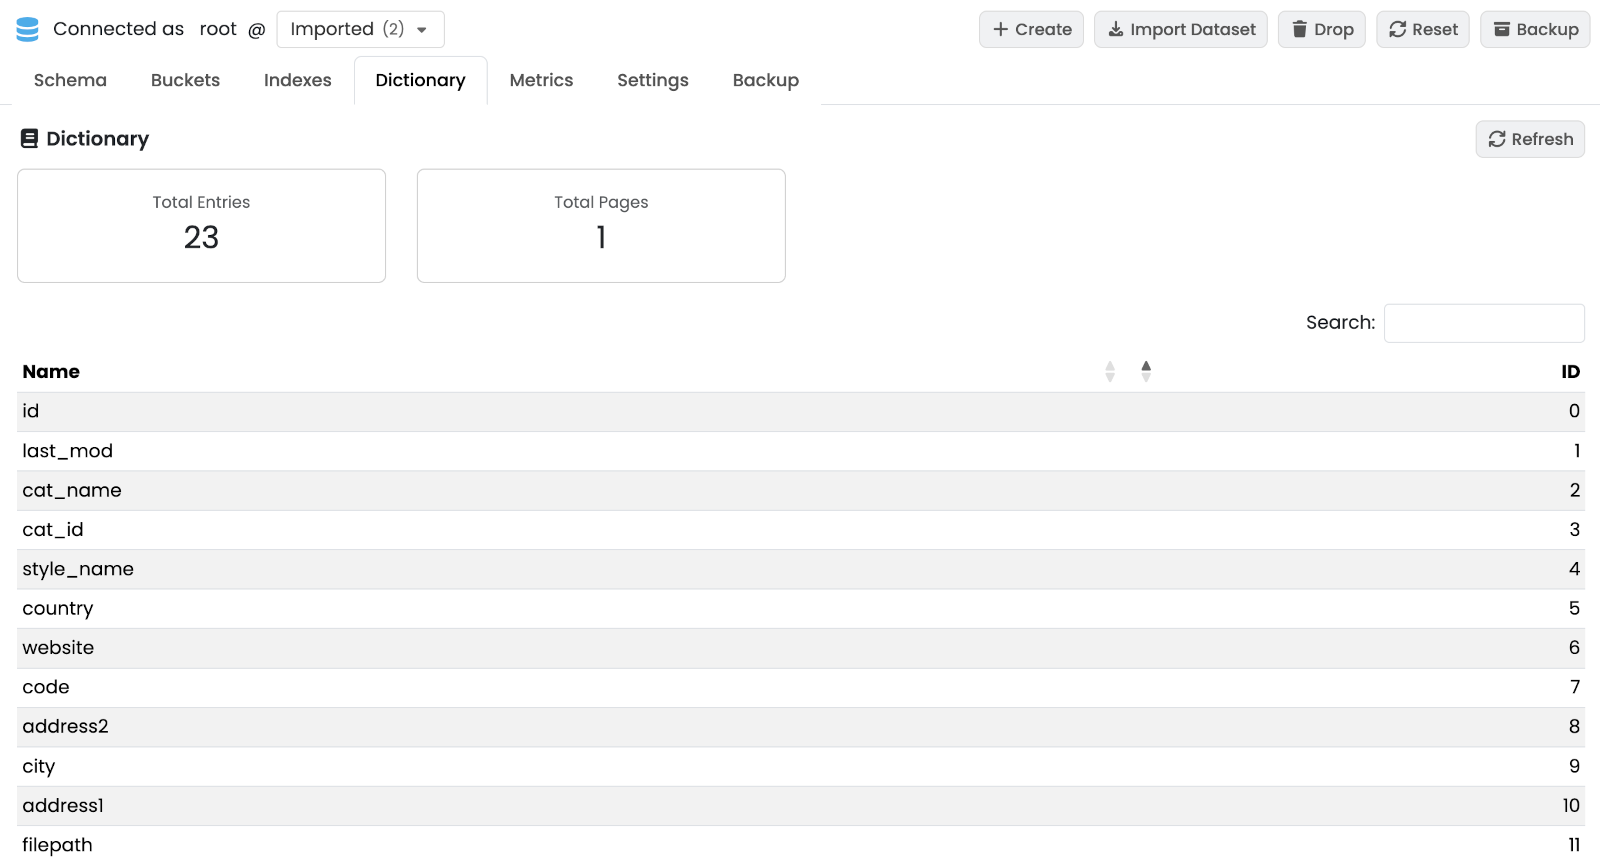
The dictionary deduplicates property names and string values across the database. The sub-tab shows summary cards (total entries, total pages) and a paginated table of the dictionary entries.
Time Series
The Time Series sub-tab holds everything about the database’s time-series types: create and drop a type, query it with the builder or PromQL, and find ingestion snippets. It is described in Time Series sub-tab. Time series types also appear in the Schema sidebar, and any time-series result can be charted from the Query panel (see Chart).
Metrics
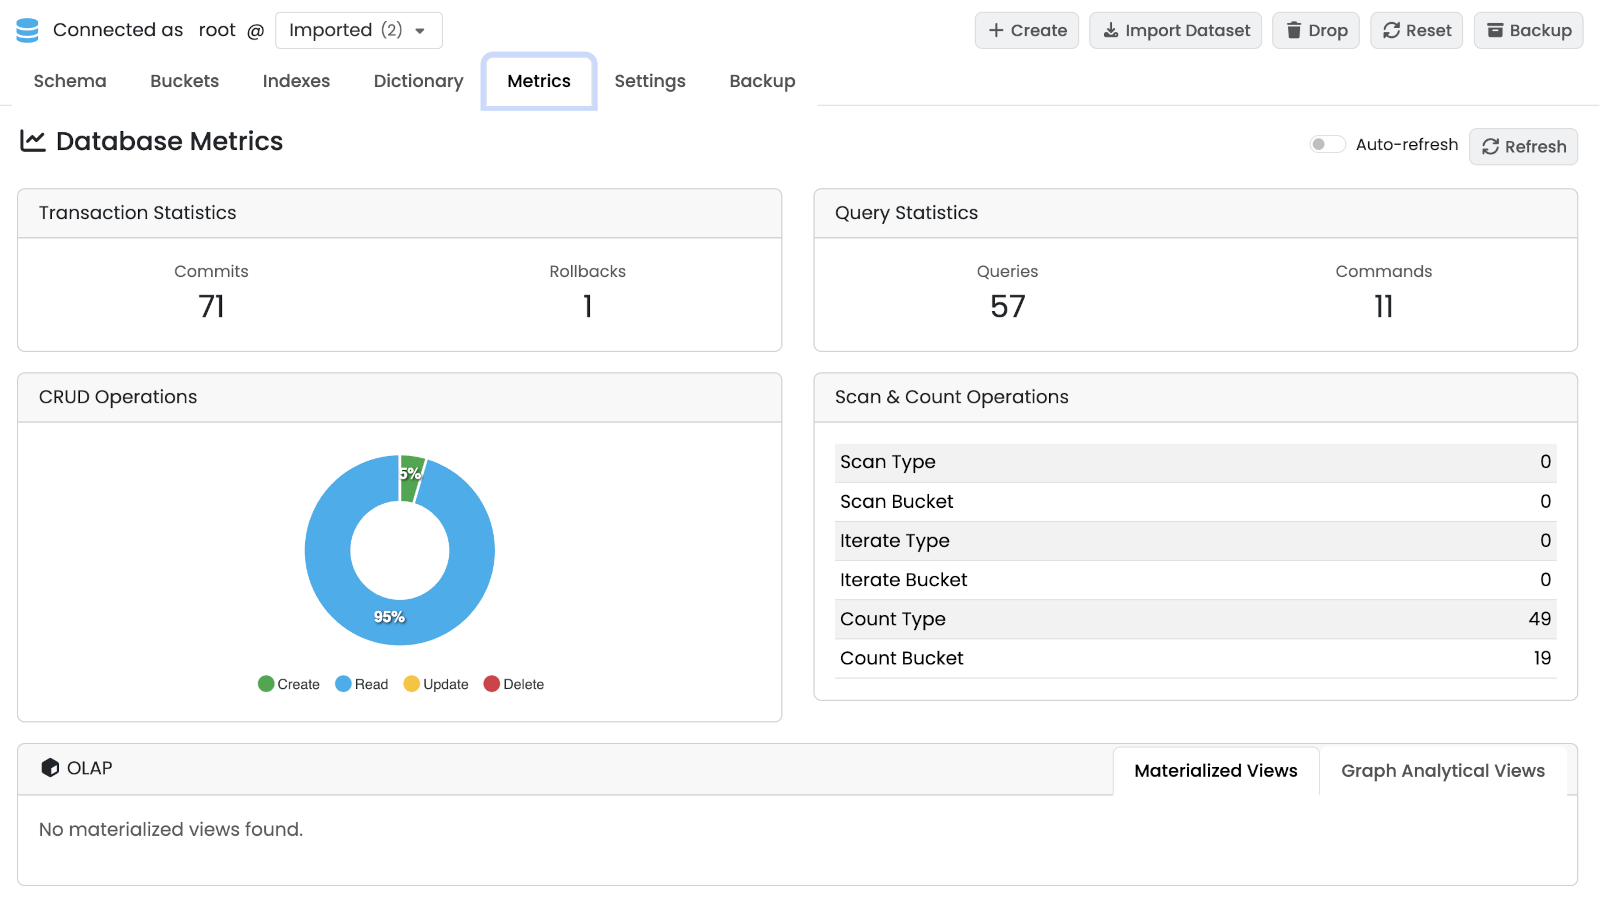
Live counters and charts for the selected database. Auto Refresh keeps the values updated at a fixed interval.
-
Transaction Statistics — commits and rollbacks since startup.
-
Query Statistics — queries and commands executed.
-
CRUD Chart — running chart of creates, reads, updates and deletes.
-
Scan & Count — full-scan and count operations per type.
-
OLAP — nested tabs for Materialized Views and Graph Analytical Views: refresh status, last computation, row counts.
Database Settings
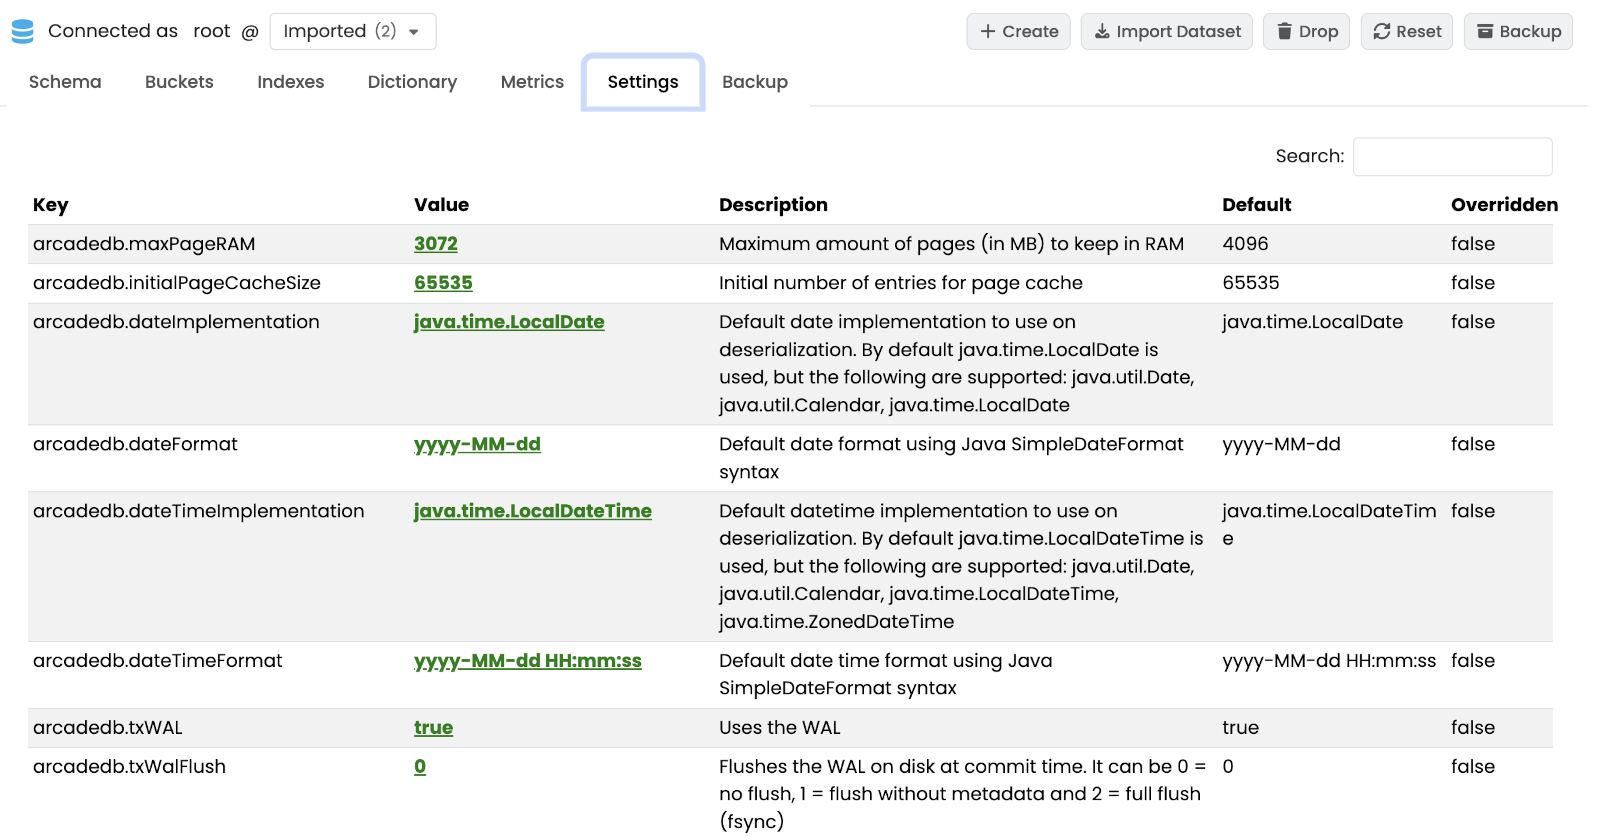
Key-value table of the database-scoped configuration settings. Values are editable by users with database-settings permission; others see a read-only view. See Settings for the full setting reference.
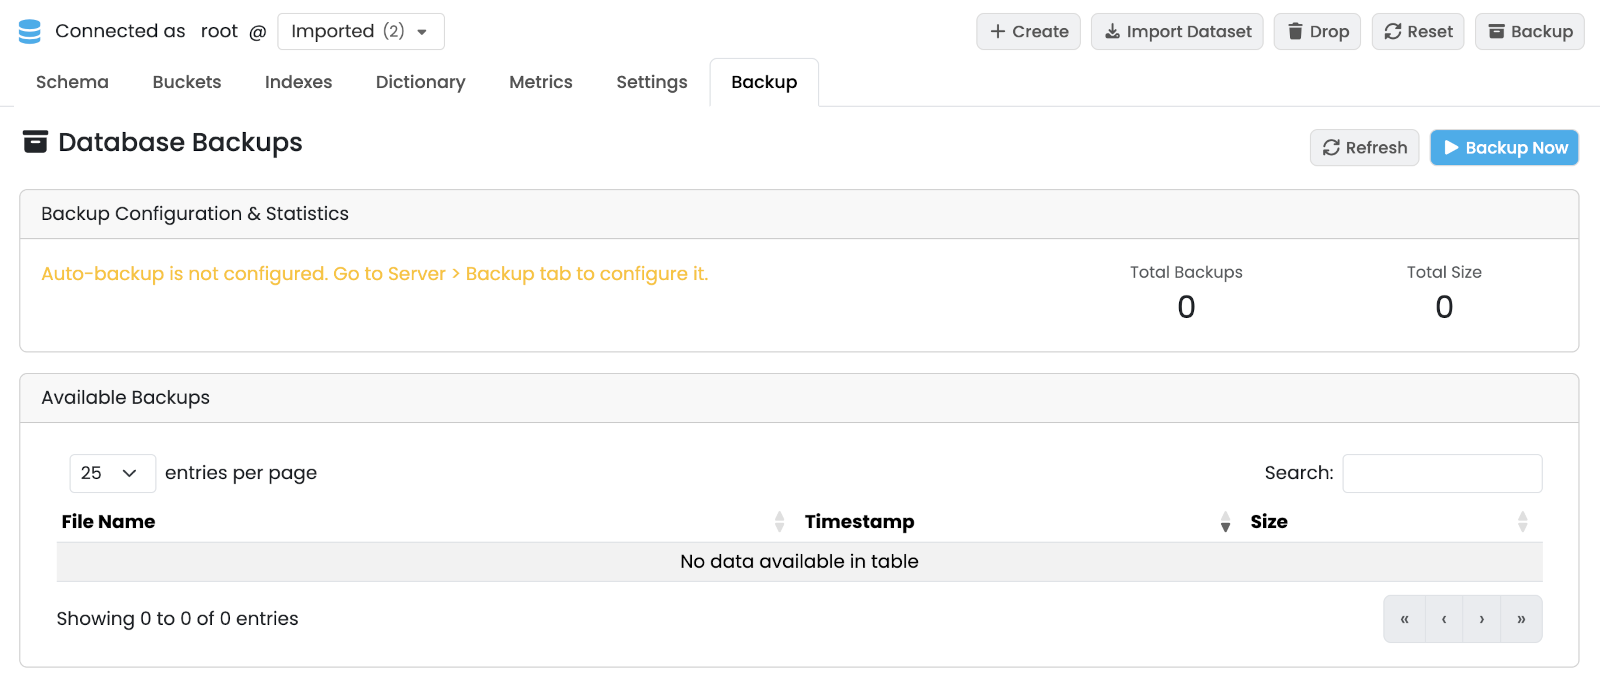
Backup
Per-database backup management.
The sub-tab displays:
-
Backup Configuration — current schedule and retention settings for this database (read-only here; configured server-wide in the Server › Backup panel).
-
Statistics — total number of backups and disk space used.
-
Available Backups — paginated list of backup files with timestamps and sizes.
From this sub-tab you can:
-
Click Refresh to reload the list.
-
Click Backup Now to trigger an immediate backup of the current database.
-
Restore or delete an individual backup from the row actions.