Profiler Panel
The Profiler panel records the queries executed on the server across every protocol (HTTP, Java embedded, BOLT, PostgreSQL, MongoDB, Redis, MCP), aggregates them by canonical form, and lets you drill into per-step timings to find slow paths. Runs can be saved for later comparison, and an Analyze with AI button (requires the AI Assistant subscription) produces a natural-language commentary on the captured run.
Toolbar
-
Start — begin a new recording. A Timeout selector next to it caps the run length (
30sto10m, default60s); recording stops automatically when the timeout elapses. -
Stop — stop the recording before the timeout (only visible while recording).
-
Refresh — re-pull the current run from the server.
-
Reset (trash icon) — clear the current run.
-
Analyze with AI — open the AI commentary panel (only shown when results are available and the subscription is active).
-
Saved Runs — dropdown of previously saved sessions; pick one to load it back into the view.
A run saved by a build older than 26.10.1 does not record how many executions each step was timed in, so Studio flags it at the top of the view and marks such steps not timed rather than showing a figure it cannot vouch for. Record the run again on a current build to get complete step timings.
|
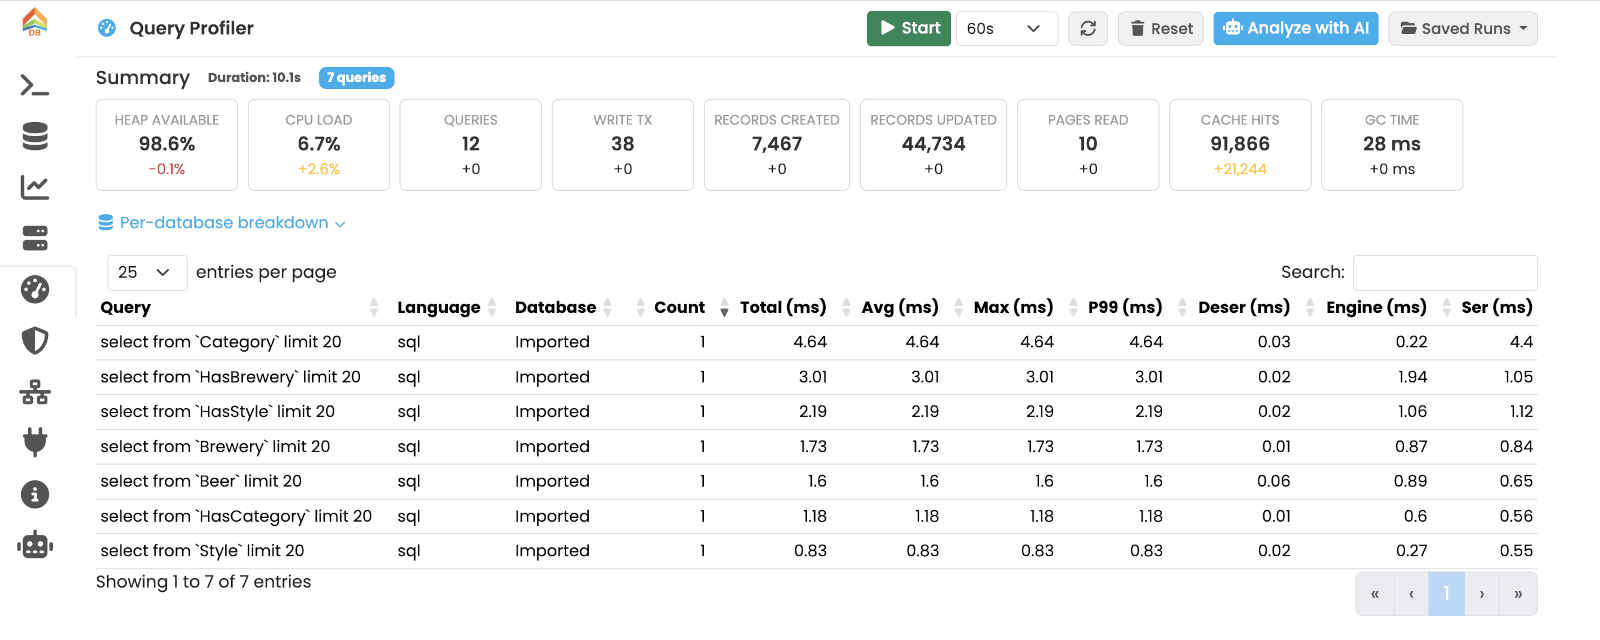
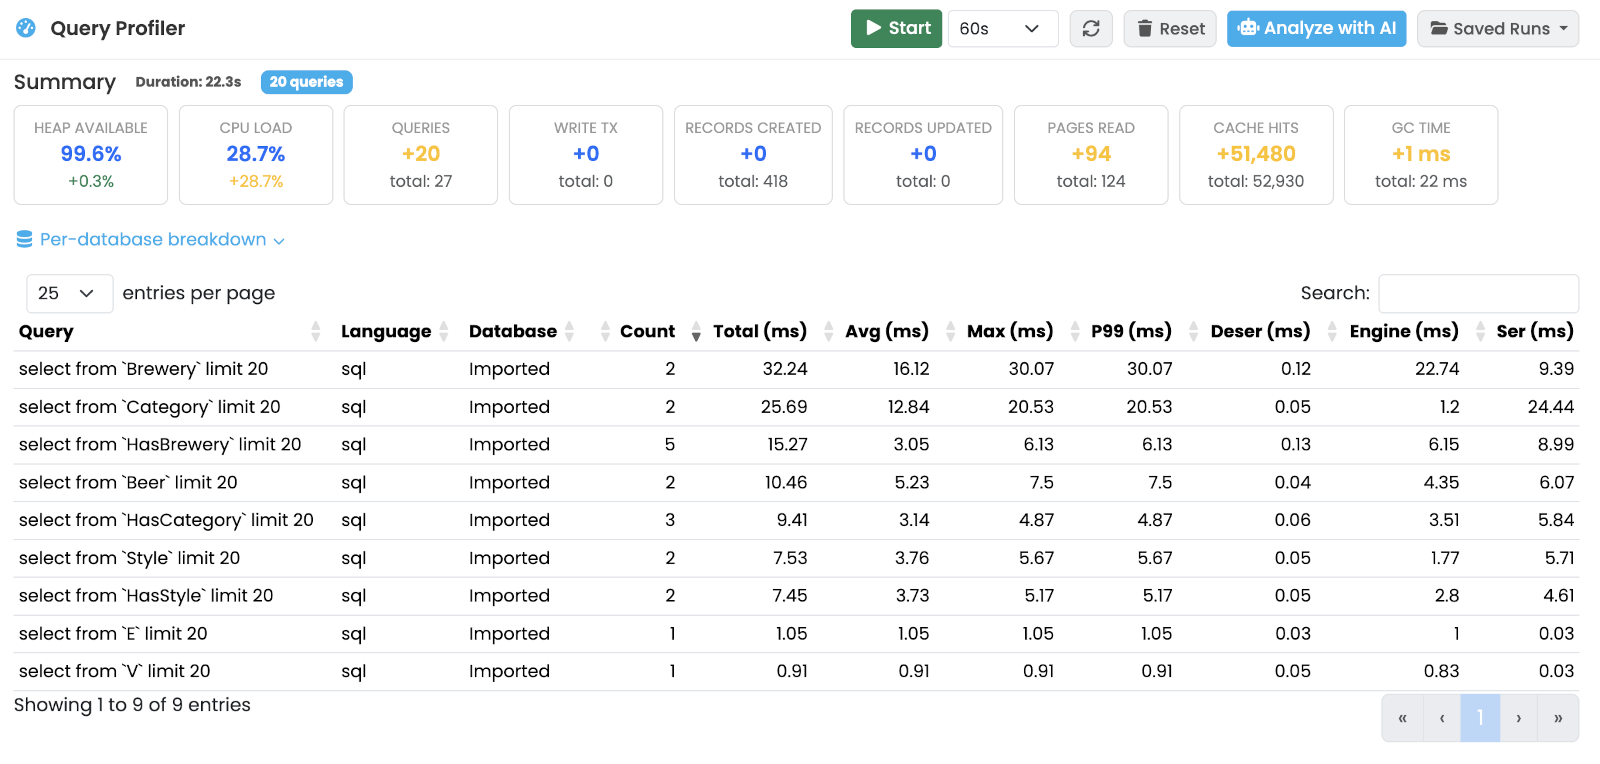
Summary
Once a recording exists, a summary header appears at the top:
-
Duration of the recording.
-
Total Queries captured.
-
Metric Delta cards comparing this run to the baseline (where applicable).
-
Per-database breakdown, collapsible.
Query list
The default view is a table of distinct queries collected during the run. Columns: Query (canonical text), Language, Database, Count (executions), Total, Avg, Max, P99 (ms), and per-stage timings Deser, Engine, Ser (ms).
Click a row to drill into that query.
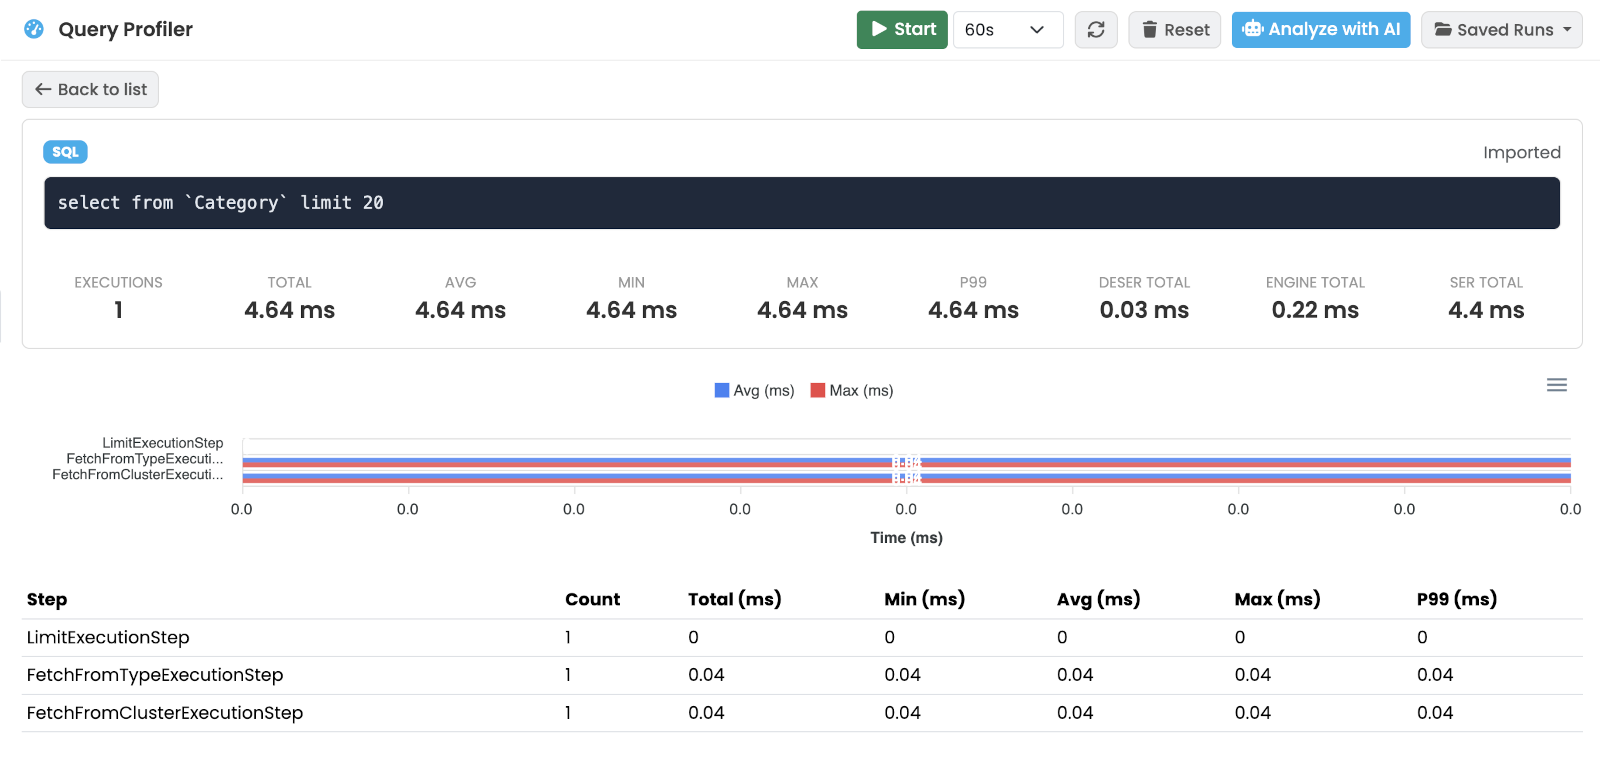
Query detail
The detail view exposes:
-
Back to List button to return.
-
Query card with the Language badge, Database, the canonical query text and stat cards (Count, Total, Avg, Max, P99).
-
Step Chart — ApexCharts breakdown of execution-step timings. Only steps that were actually timed are plotted.
-
Step table — for each execution step: name, count, measured, total, min, avg, max, p99 (ms). Measured is how many of those executions the step was actually timed in, so an average drawn from 3 of 100 executions says so instead of reading as if it covered all 100. (Since v26.10.1)
Step timings are the time each step spent in its own work - never the time the steps below it spent in theirs - summed over every occurrence of that step across all the executions of the query.
Because no step counts another step’s time, the rows add up to at most the query’s Engine total and never more, and the largest row is the step actually worth optimising.
A step the engine did not time is shown as not timed rather than as 0 ms, so it is not mistaken for work that completed instantly.
A step whose only job is to hand work to the steps below it therefore appears with a count but without timings: the time is reported on the step that did the work.